Reading the chart
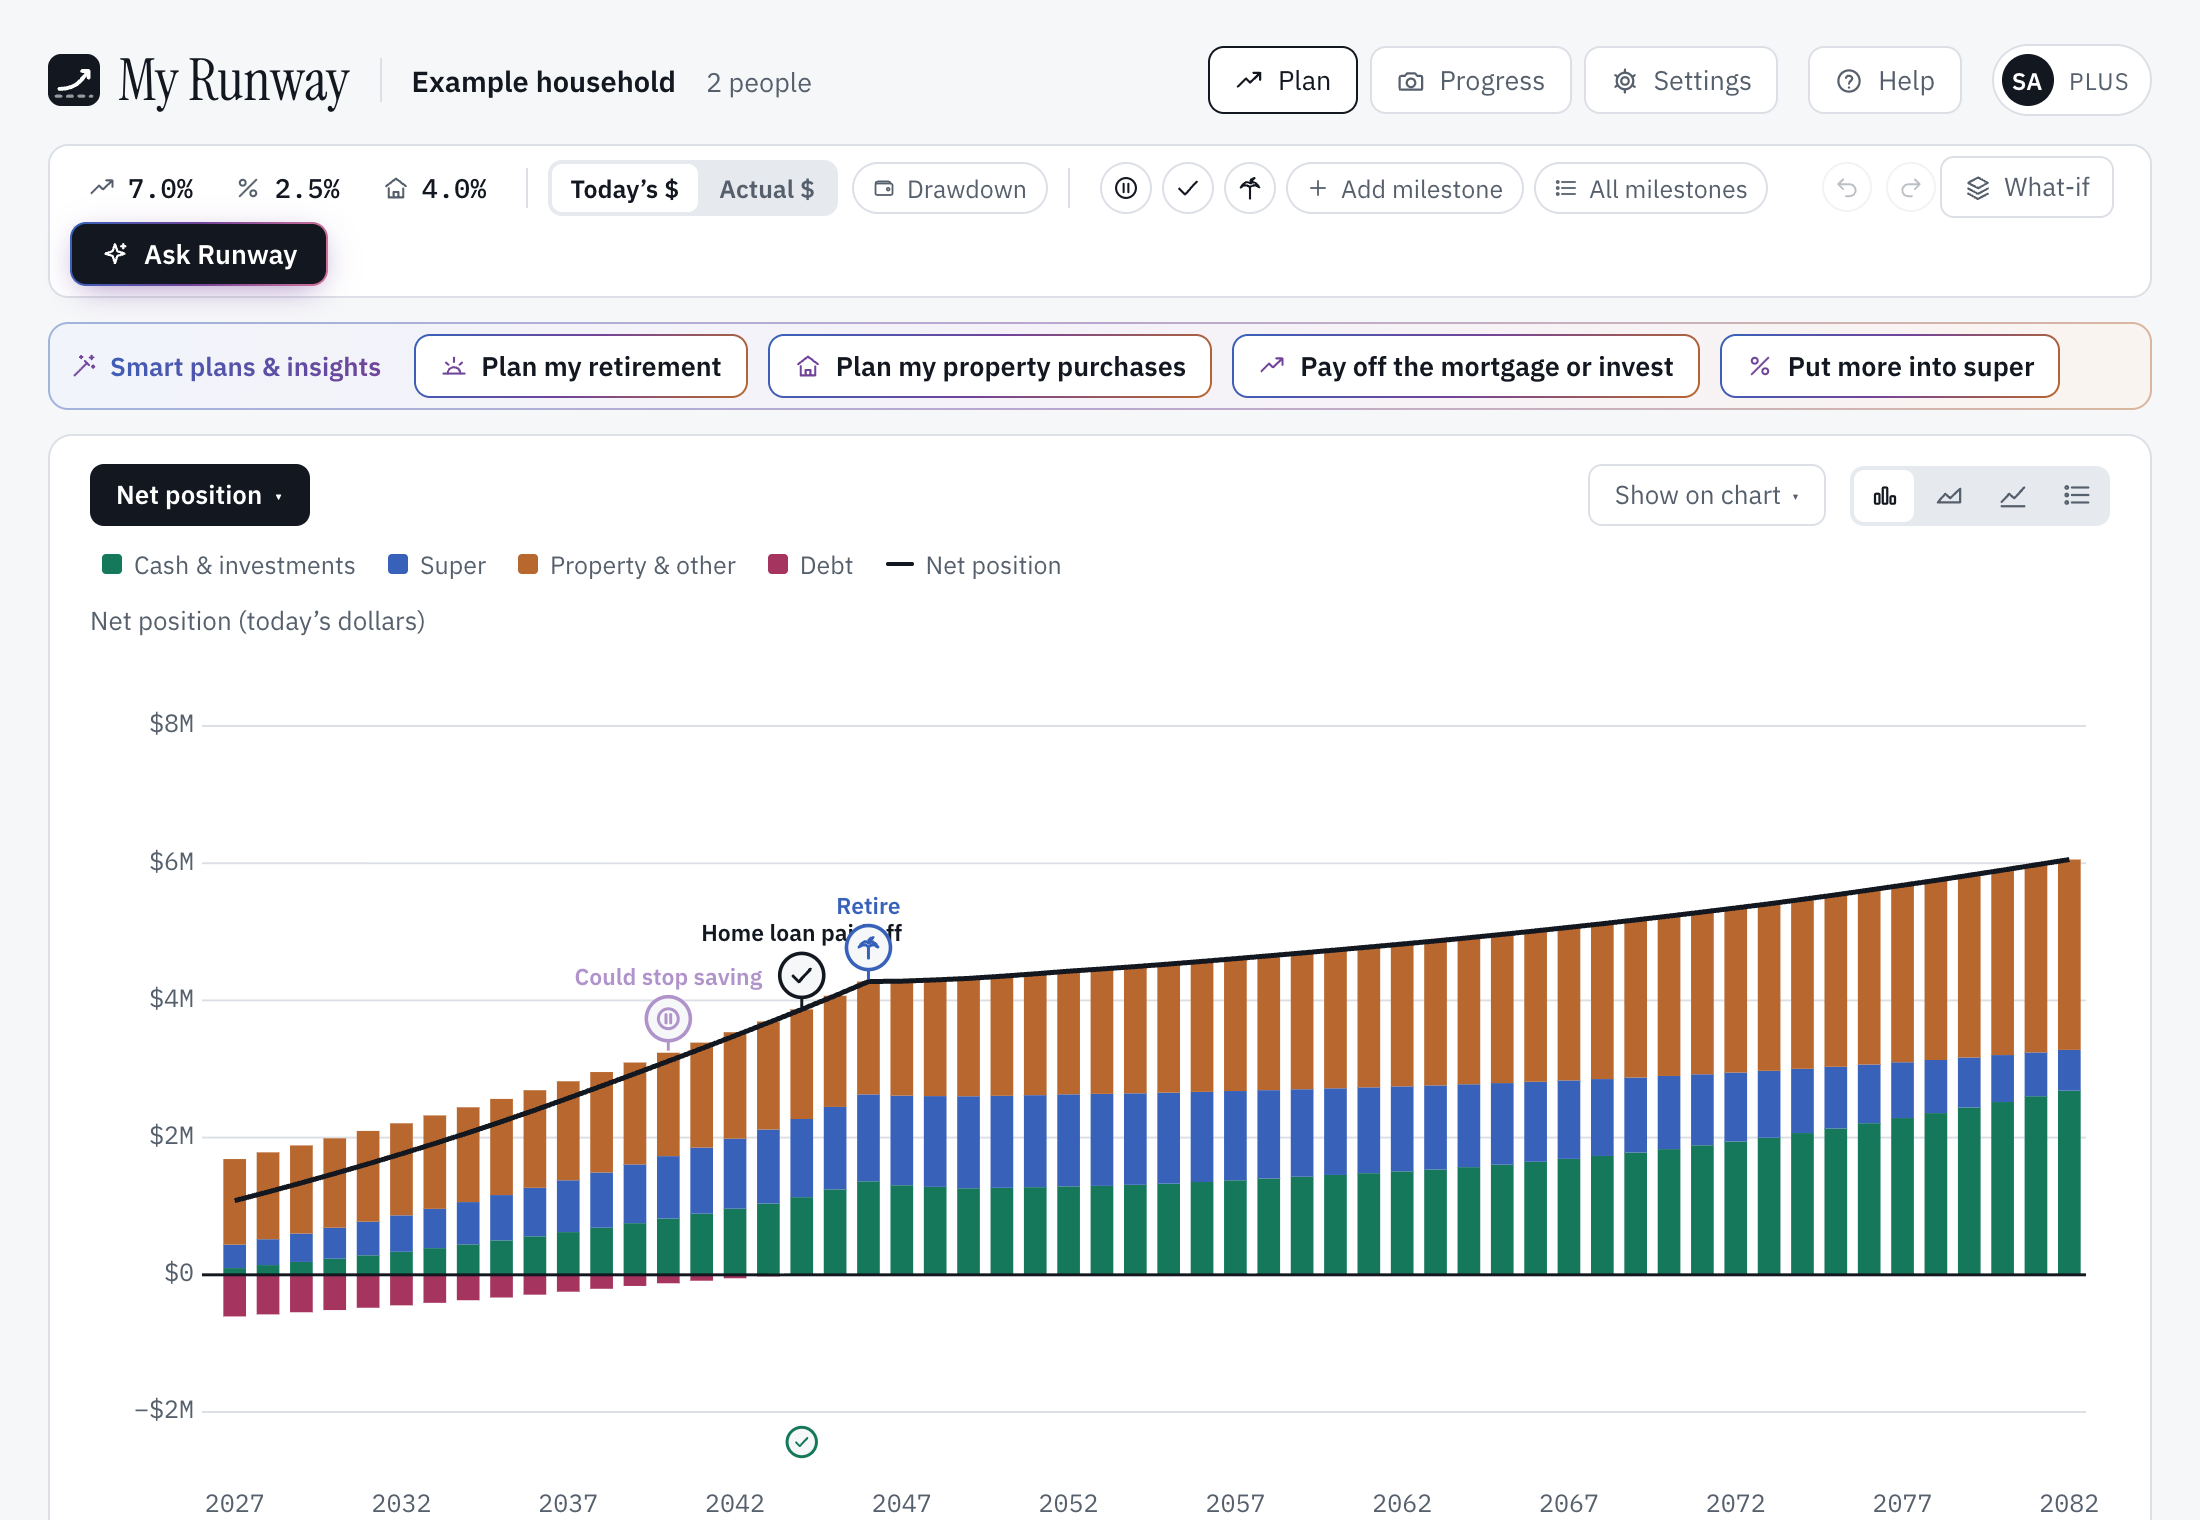
The chart shows one bar for each financial year, from this one to the end of the plan. Net position is what you own less what you owe.
The menu above the chart, named for the view you’re on, holds the other views of the same projection, in three groups. What you own and owe: Assets, Liquid assets and Fixed assets (each account or property on its own band), Debt (each loan) and Super vs outside. Money in and out: Income (each source, and, lighter, what is drawn from each account to live on), Expenses (each expense, with tax, property costs, loan repayments and purchases), Passive income (what each investment pays, less its property costs and loan interest), Income & expenses and Cash flow. Tax: Tax, by kind, with the effective rate as a line. When there are many bands, the smallest share one, such as “Other accounts”.
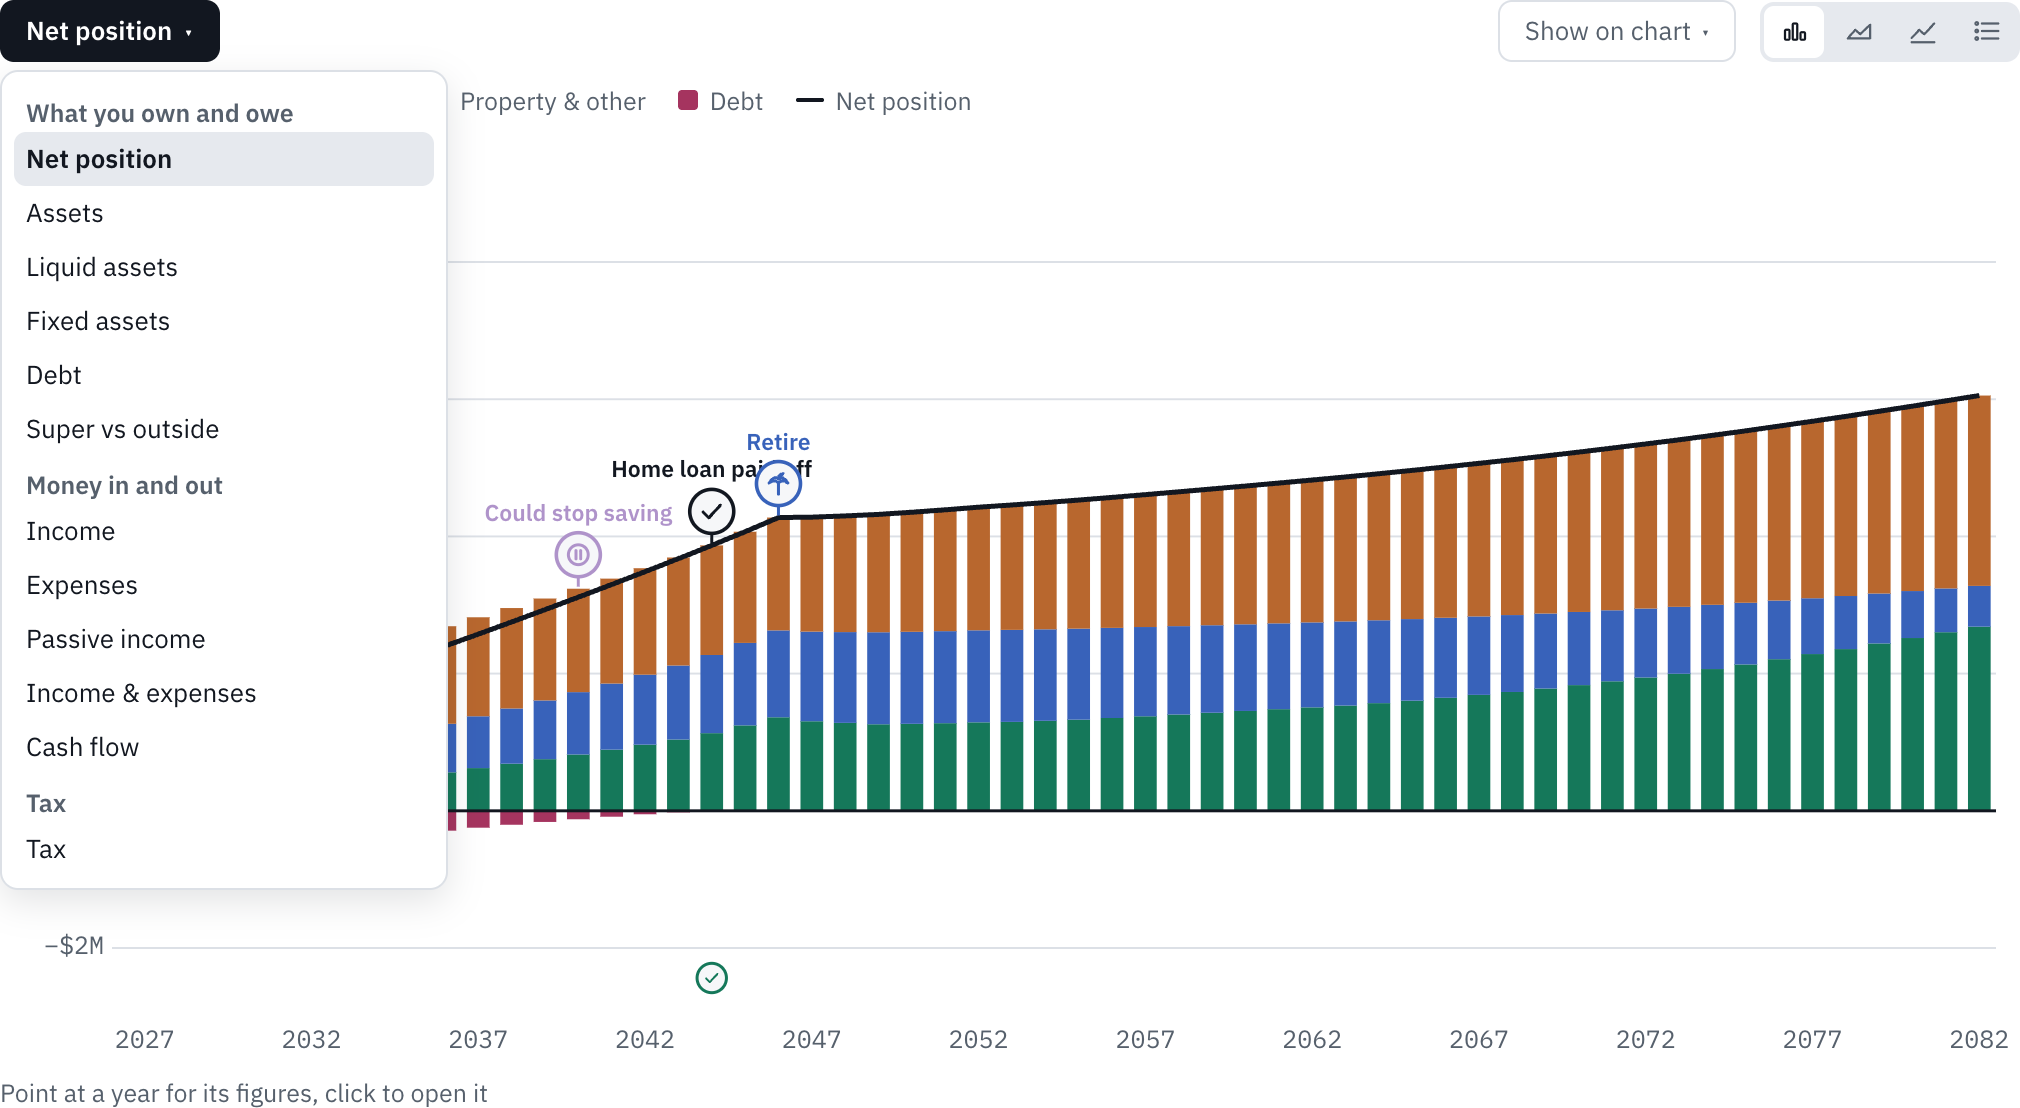
Draw it as Bars, Stacked area or Lines, or as a Table of the same figures. Click an entry in the key to hide or show it. On the free plan, Net position is open; the other views and the table show a padlock and a preview.
Point at a year for its figures and everyone’s age then. Milestones sit above the bars; purchases, sales and debts paid off sit in a row of small icons beneath them. Show on chart (an eye, on a phone) turns each kind on or off, and ages under each year too.
Open a year
Click a bar to open that year: its closing net position and how it changed, what happened, its assets and debts (opening, change and closing), and its income and expenses down to the surplus or shortfall, with where it went or what covered it. A part with a change that year opens by itself and says why. Click a row to open its card. Anything you add while a year is open starts in that year. On a phone, the arrows either side of the year step to the year before or after. All years goes back.
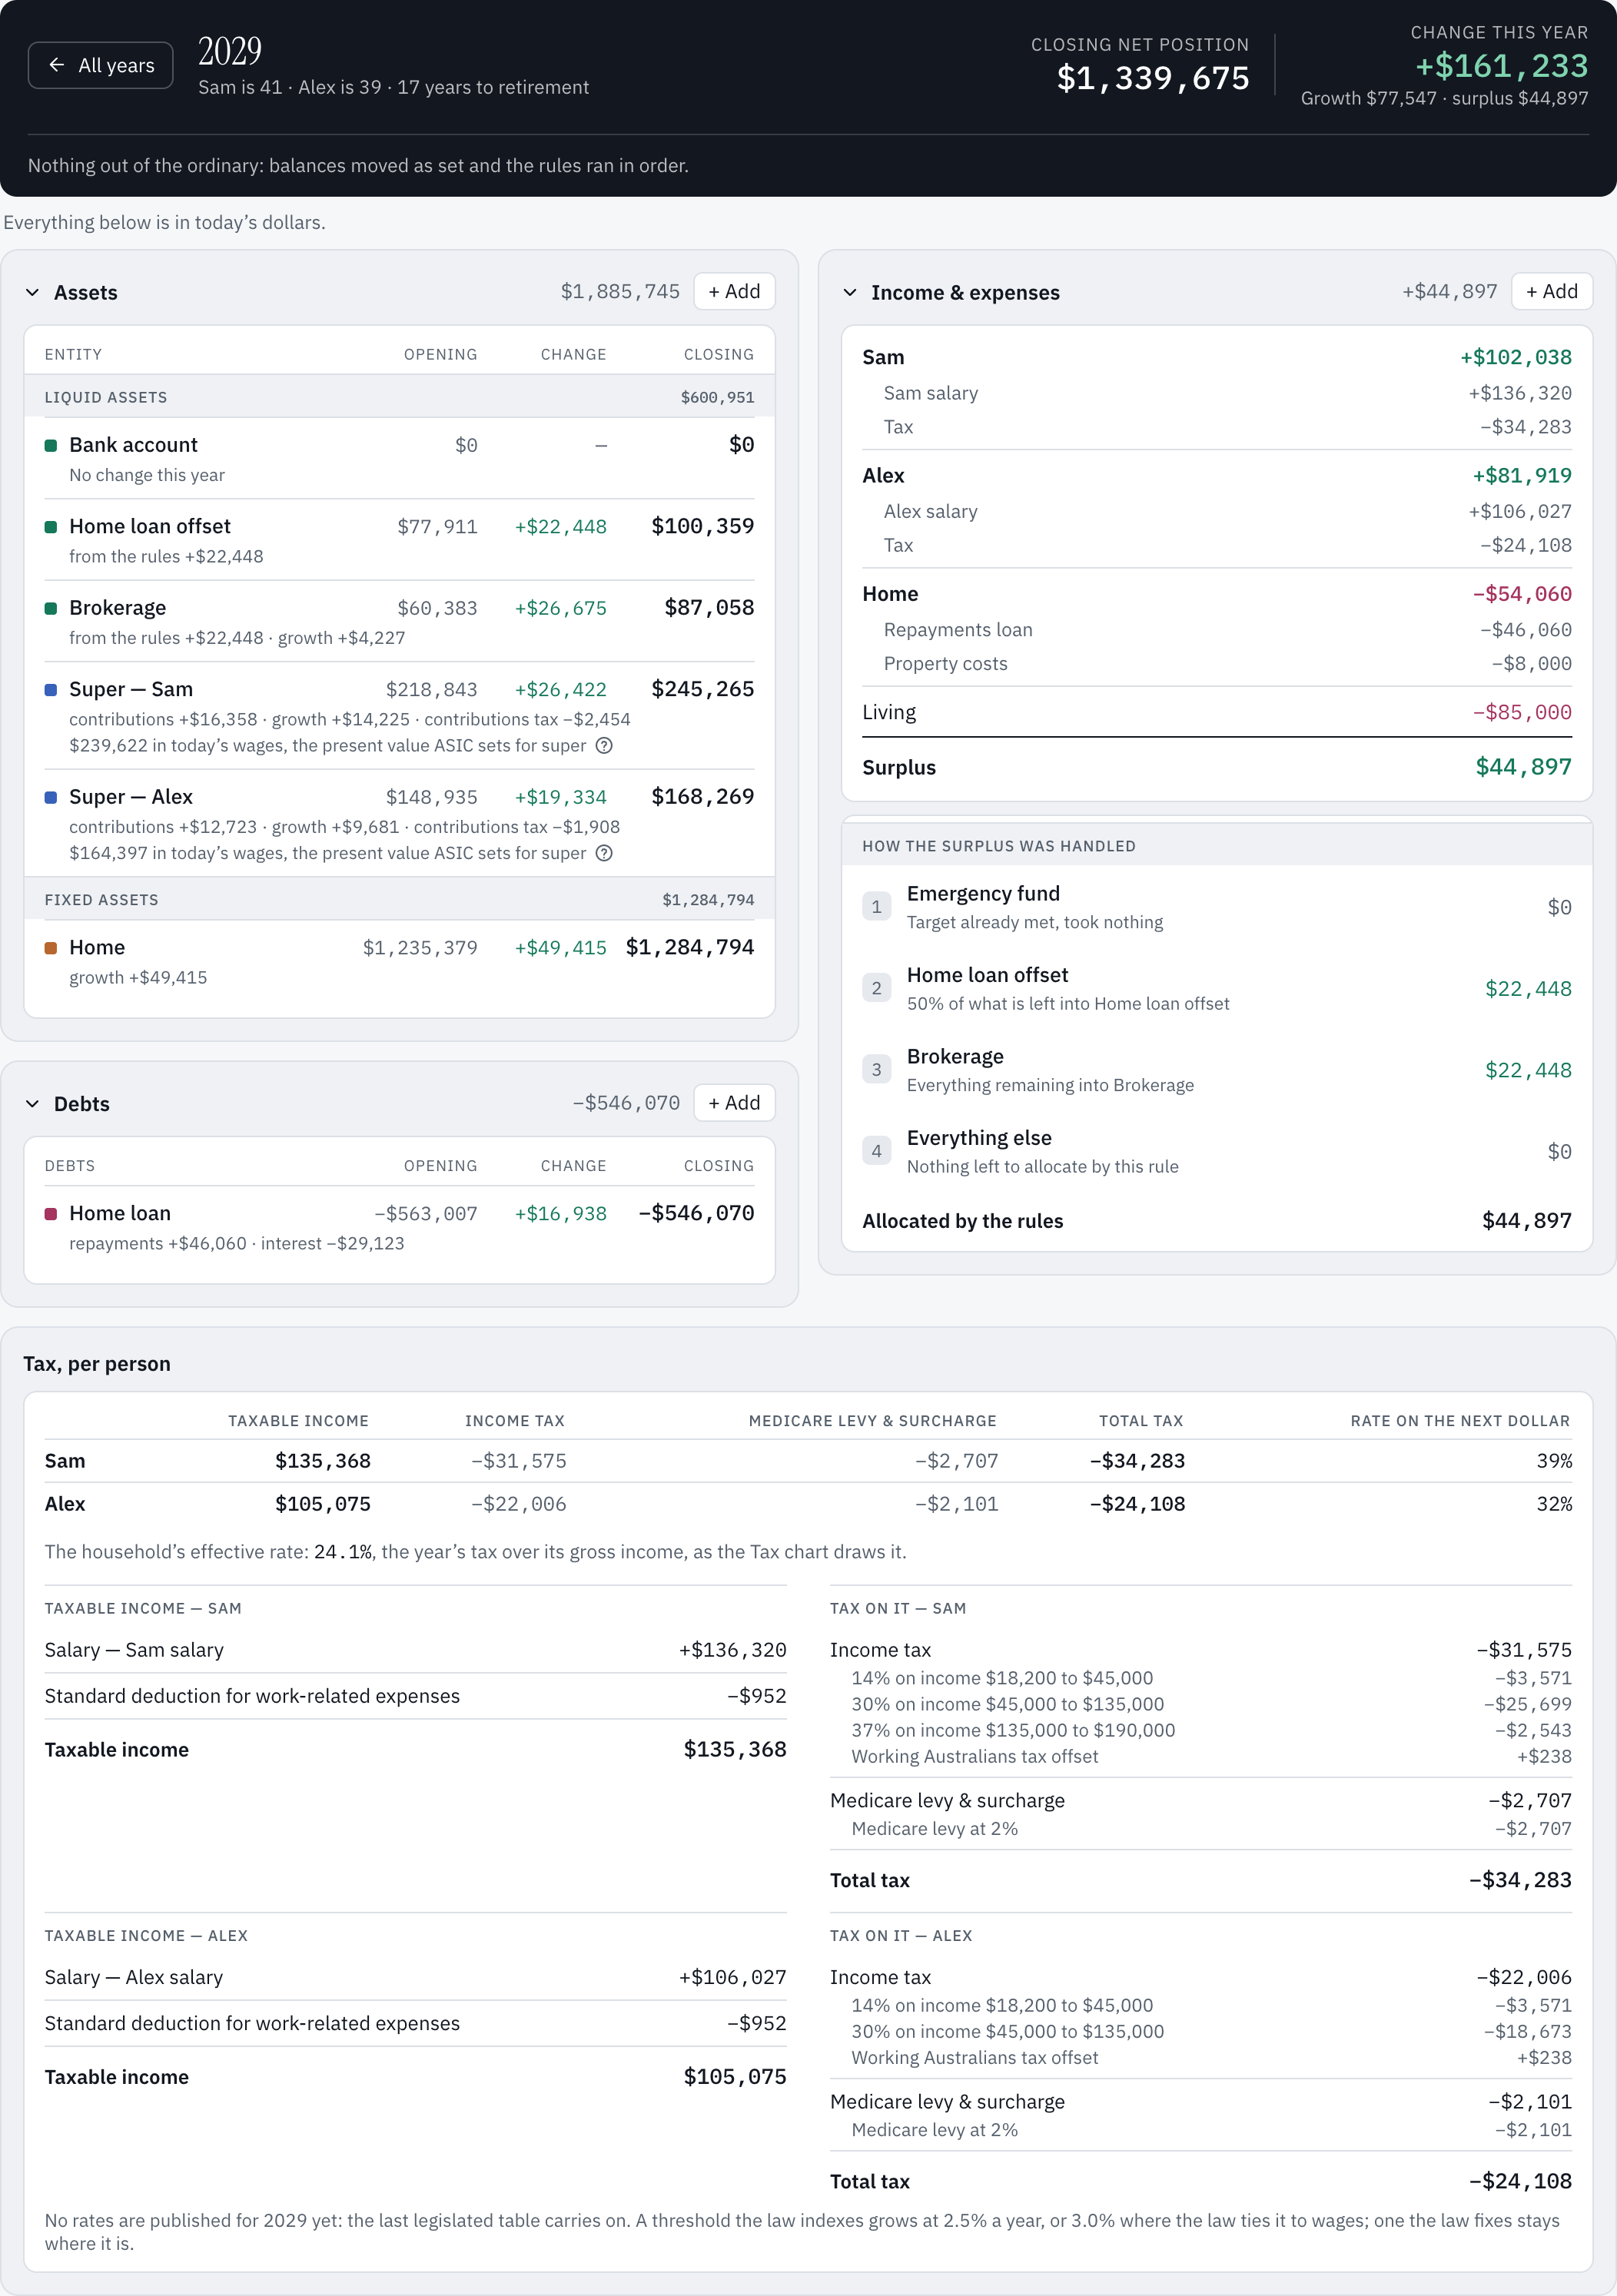
On the free plan, a year shows the totals: money in, tax, living costs, and one line for where the surplus went. Advanced insights (Plus) lists every line, how each rule took its share, and each person’s tax workings, with the rate on their next dollar (income tax, the levies, any study loan repayment and, on a high income, Division 293) and the household’s effective rate for the year.
With the keyboard: the arrow keys move between years, Home and End go to the first and last, Page Up and Page Down move ten years, Enter opens one, Escape closes it, and, on Plus, T switches to the table.
Today’s dollars
Figures are in today’s dollars unless you switch them, so an amount in 2045 reads as what it would buy now. The switch above the chart is Today’s $ and Actual $, the dollars of each year. A card for something that starts later shows its figure in the same dollars, whichever ones you typed it in; its editor says which, such as “Borrowed, in 2040 dollars”.
Super also shows a second figure, in today’s wages: the measure ASIC sets for super calculators. Until the person retires (their Retire milestone, or 67 without one, and never before their preservation age) it divides by wage rises, 3.7% a year unless you change it, and after it by inflation. Wages rise faster than prices, so it reads lower than today’s dollars. You see it when you open a super account (its balance at retirement), beside its balance in a year you open, in Put more into super, and under Plan my retirement’s answer (the spending a year, paid partly from super), each with a ? that explains it. It comes from the same projection and changes nothing else.
When the money runs out
A year the plan can’t pay for is washed red on the chart, and a card above it says The money runs out in that year: your age then, the Years short and how much is short in all. Its buttons open that year, the Drawdown order, or Try a what-if (Plus). The card can’t be dismissed; it goes once the plan pays its way.
The rates above the chart
The investment return, inflation and property growth sit above the chart as a percentage each; point at one for its name. Click one to change it for the whole plan with the − and + or the slider, and the chart moves as you drag. On a phone the three sit together behind Rates. Anything that has set its own rate keeps it. The rest of the rates are in Settings, under Rates.
Still stuck?
Signed in? Choose Help at the top of the app, pick what it’s about and tell us what happened; it reaches us with the page you were on, and you get a copy. Otherwise write to [email protected]. We reply by email. Please don’t send passwords or account numbers.